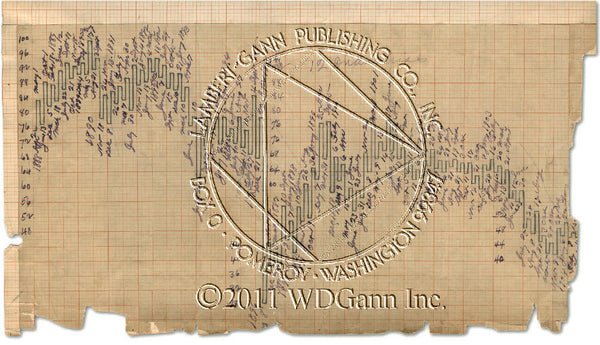
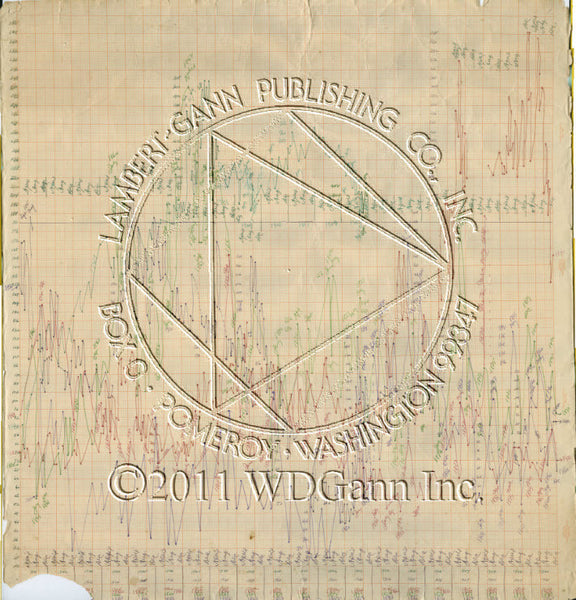
1951 Rubber Chart Limited Edition
Only 51 copies of this chart will ever be printed-and this is a great one to have! All charts will be numbered and earliest orders get lower numbers.
Note-The image quality of the chart online is deliberately low resolution. The chart you will receive will be a perfect image of the original. The large watermark will also not be on the chart you get. There will be a small watermark on the charts that will not take away any data from the chart.
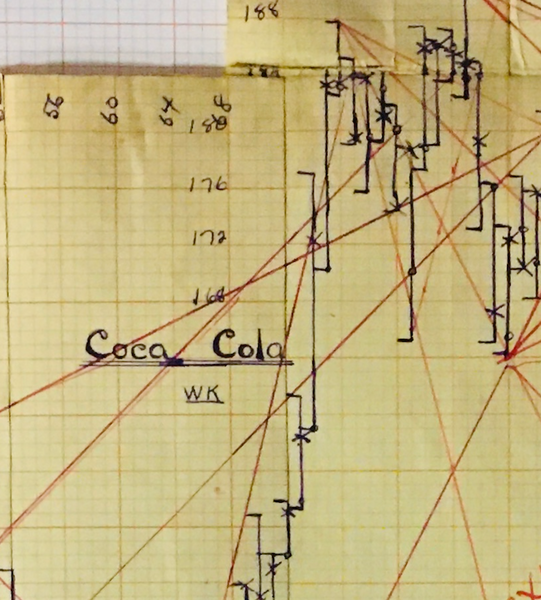
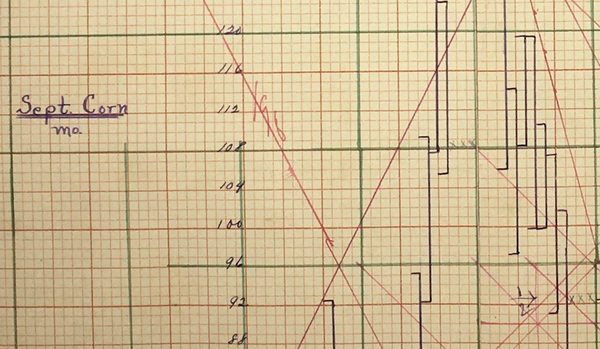
This is custom chart paper that W.D.Gann had made. It is based on his Price Time Trend Calculator. These charts were used by W.D.Gann in the late 1940's and early 1950's-so some of his later work. This particular chart has data from 1951 on the March Rubber Contract.
These charts were built to "stack" and data can be seen and read in different ways. Lots to study and discover in this chart.
This chart measures 26 x 26 inches.


